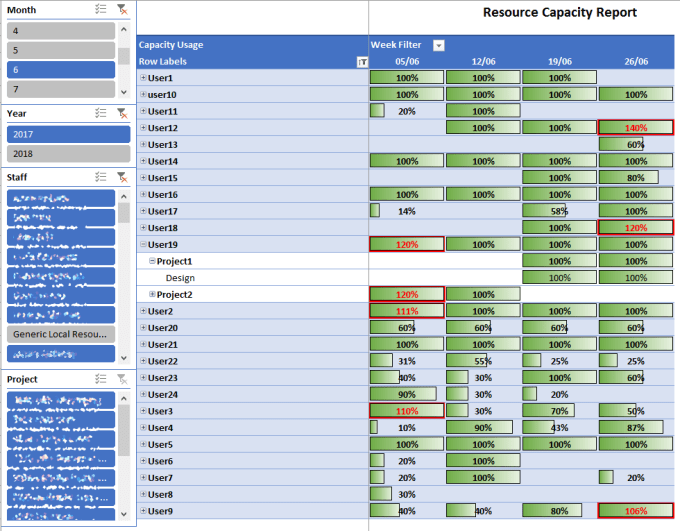
I’ve recently been doing some work on creating a Resource utilization report based on data taken from Project Server 2013. The requirement was that it should stay up-to-date with project Server and should be able to show at a glance when resources were overbooked.
In this article and potentially a few others I plan to cover every required step from creating the data connection to formatting it all in a useable format, what you will end up with will be a report similar to the report in the image above or below using an OData Query –
Setting up the Data Connection
- Open a blank workbook in Excel.
- Expand the ‘Power Pivot’ Ribbon (If you don’t see it then follow these steps).
- Select ‘Manage’ in the Data Model Section.

- The Data Model window should now open.
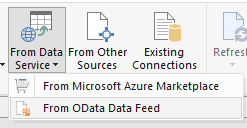
- Expand ‘From Data Service’ then click ‘From OData Data Feed’.
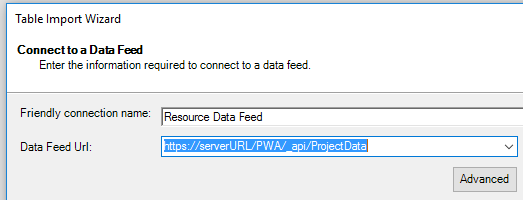
- Enter a Friendly Connection Name and then enter the Data Feed URL for your Project Server which will be similar to below (https://serverurl/PWA/_api/ProjectData) –
- Check the required tables, for this example select ‘AssignmentTimephasedDataSet’ and ‘Resources’ tables and then click Finish.
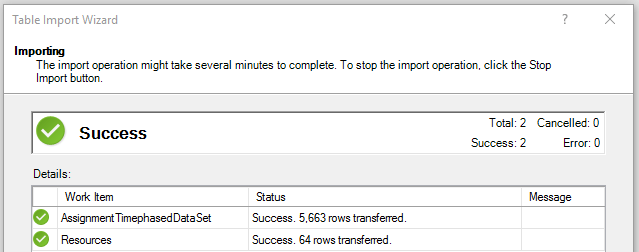
- Excel will now query the tables, depending on the size of your database this could take some time.
- Once done Excel will display the following –
- Click Close to proceed.
- You should now see both of the tables you queried and will be able to modify the data and columns as required.
Cleaning up the Queried Data
This is a good point to clean up the data in the two tables that we’ve now got, we’ll remove all extra columns so our future queries are quicker and we’ll also set up a relationship between the two tables so we can show the actual resource name and finally add two calculations so we can group by the week (which the ‘TimeByDay’ fields won’t allow you to do by default).
- First we’ll remove all unneeded columns from the tables, hover over the top of the column name and a small black down-facing arrow should appear, drag over all of the columns to remove then right-click to delete them.
- You want the AssignmentTimephasedDataSet to look like below –
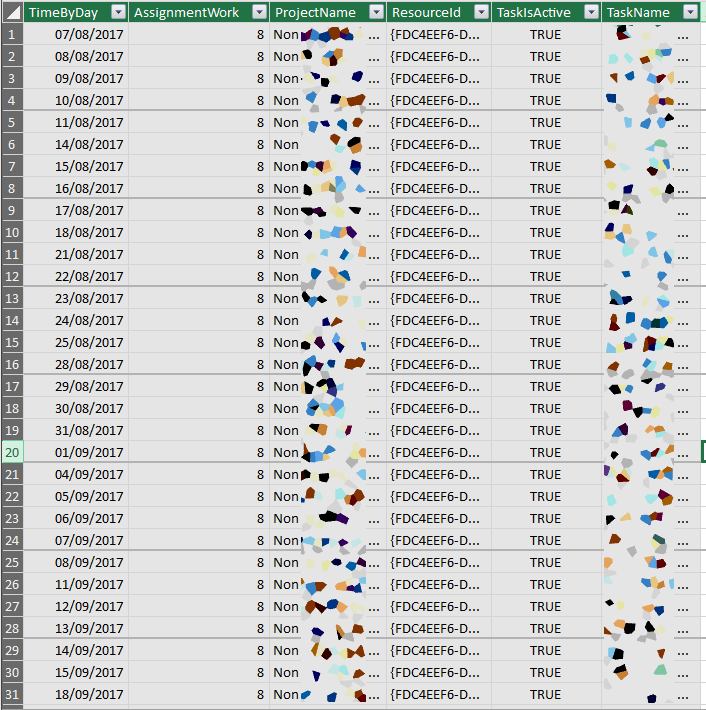
- I’ve only kept the following fields –
- TimeByDay – This will be the base of the time data.
- AssignmentWork – This tracks assigned work hours for resources.
- ProjectName – This allows us to show what project the Resource is assigned to.
- ResourceId – This will link to the Resources database to allow us to show the Resource Name.
- TaskIsActive – Won’t use in this but can be used to filter if required.
- TaskName – Allows us to show the task name.
- I’ve only kept the following fields –
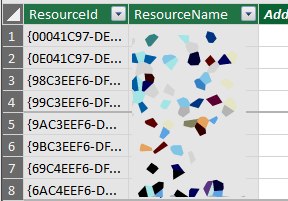
- Now click the Resources tab at the bottom-left of Excel to open the Resources table and do the same, remove every column except ResourceId and ResourceName similar to below –
- Now that the data has been cleaned click ‘Diagram View’ in the ribbon, from here we’ll create a relationship between the ResourceId field in the AssignmentTimephasedDataSet and the ResourceId field in the Resources Table so that we can show a resource name rather than just a unique identifier.
- You should see two tables similar to below, right-click one of them then click ‘Create Relationship’ in the menu.
- Select ‘ResourceId’ in the AssignmentTimephasedDataSet and ‘ResourceId’ in the Resources table then click OK to connect them.

- Now navigate to the AssignmentTimephasedDataSet table again and click ‘PivotTable’ in the ribbon to create a PivotTable from the data.
- Click ‘Existing Worksheet’ in the popup and a new Pivot Table will be created from the data you’ve imported.
Set up Calculated Fields
Before continuing we need to create a few calculated fields in the data source which will allow us to show utilization by week, to correctly filter by the month (based on week start) and to calculate the actual utilization of a resource.
- Expand the ‘Power Pivot’ ribbon and click ‘Manage’ similar to in the last article.
- You should now be seeing the AssignmentTimephasedDataSet table.
- Select the first field under ‘Add Column’ and add the following calculation –
-
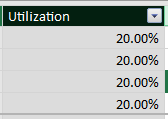
=[AssignmentWork]/40
-
- Select the field again and then in the Formatting tab change the Data Type to ‘Decimal Number’ and the Format to ‘Percentage’.
- Double-Click the heading of the column and change the name to ‘Utilization’. This gives us a basis for calculating how much each resource has been assigned on a single day.
- Now we need to calculate what the date of the first day of the week that a task is assigned to is, this will allow us to group everything by week and will allow us to show information nicely.
- Select a blank field right of the ‘Utilization’ column and add the following calculation –
=[TimeByDay]-WEEKDAY([TimeByDay], 3)
- This gives us the information we want but let’s tidy it up a bit.
- Change Data Type to ‘Date’ and change the Format to ’14 March’.
- Change the name of the column to ‘Week Starting’.

- Finally we need to calculate what month a given week falls on, this will allow us to accurately filter based on the month.
- Select a blank field right of the ‘Utilization’ column and add the following calculation –
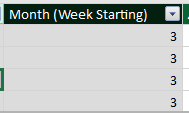
=MONTH([Week Starting])
- We don’t need to format this further but be sure to change the name to “Month (Week Starting)” or similar.
- Now you’ve got all the information we’ll need to create the Pivot Table.
Next week I’ll cover setting up and formatting the Pivot Table to get to the report I showed at the start. Stay tuned and be sure to comment below if you found this article helpful.
The second post in this series is now available covering “How to Create a Project Server Resource Utilization Report – #1 Data Connections“

Hello! I merely would wish to supply a massive thumbs up with the excellent info you’ve got here with this post. We are coming back to your site to get more detailed soon.
LikeLike